Blog
All posts
tradingvieworder-flowmarket-microstructuretrading
Use DepthSignal Beside TradingView, Not Instead of It
Henry Steinberg8 min read
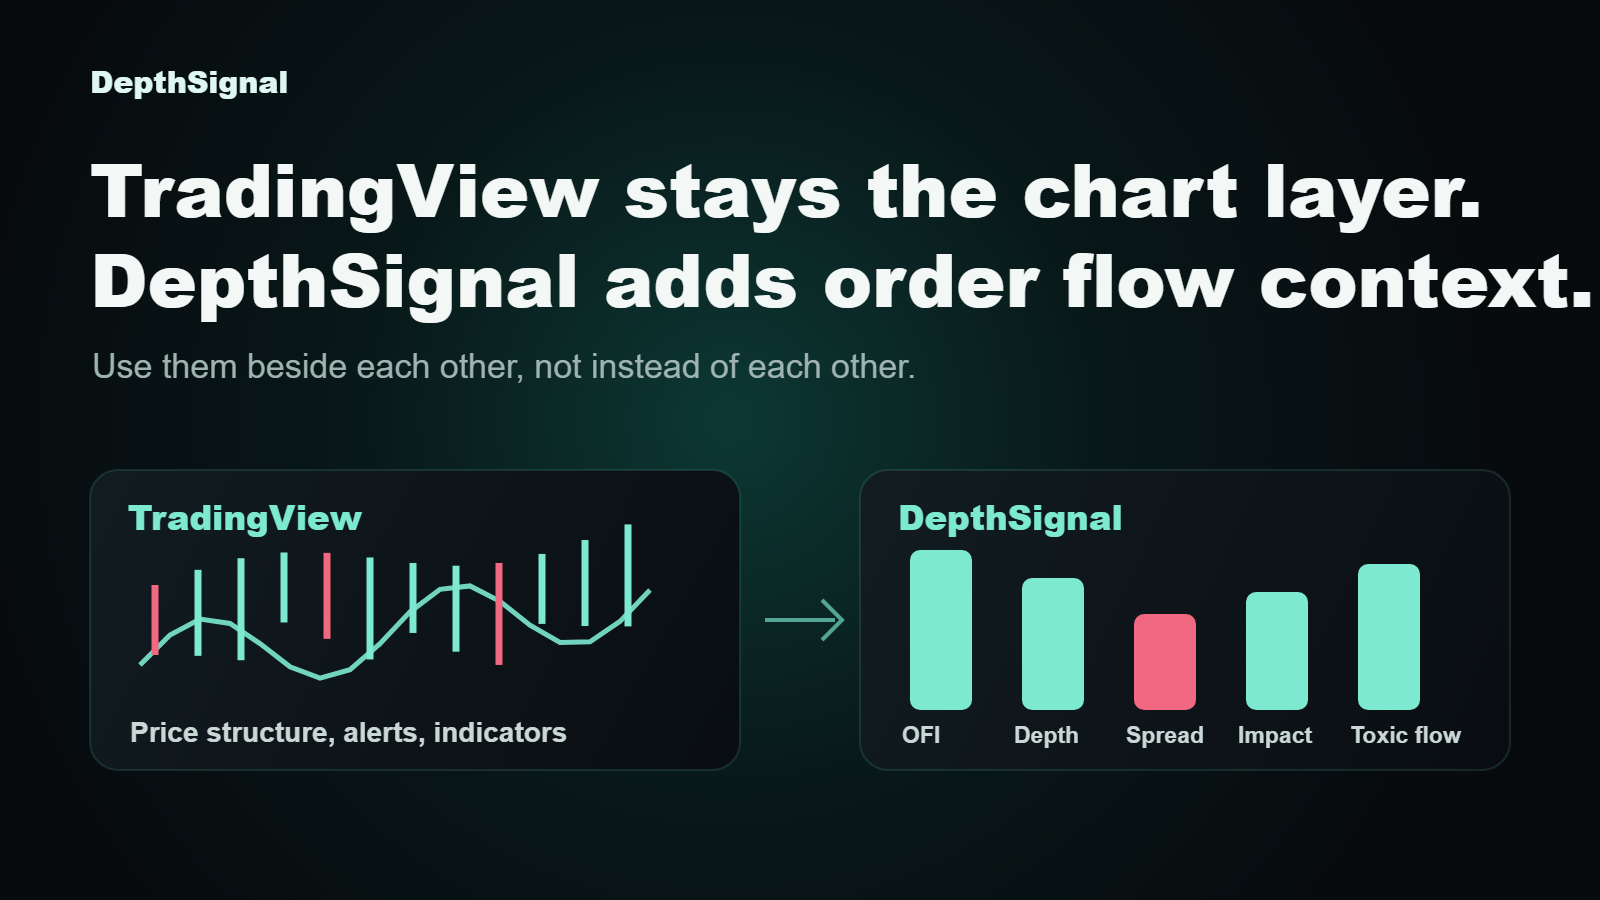
Traders who already use TradingView often have the chart layer covered. Order flow context beside TradingView is the missing layer when the chart looks clean but the auction underneath is changing. DepthSignal is built to sit beside that workflow, not replace it.
The point is simple. Keep TradingView for chart structure, indicators, alerts, watchlists, and visual workflow. Use DepthSignal for current market context around order flow, liquidity, spread, depth, toxic flow, price impact, and market context checks. A candle tells you what printed. The orderbook shows observed liquidity and flow around the move before and after it printed.
Short answer: use TradingView for chart structure. Use DepthSignal as a second check for order flow imbalance, orderbook depth, spread, price impact, toxic-flow context, and venue context before turning a chart setup into a stronger claim.
DepthSignal is independent and is not affiliated with, endorsed by, or sponsored by TradingView.
A 60-Second Side-by-Side Workflow
The clean workflow starts on TradingView and ends with a smaller, better claim.
Start with the chart. Mark the level, trend condition, volatility state, or indicator setup. Then read the market context beside it. OFI asks whether aggression supports the setup. Depth asks whether liquidity is still there. Spread asks whether immediacy has become more expensive. Price impact asks whether the book is fragile. Toxic-flow context asks whether the market is clean enough to interpret.
The output is not a command. It is a classification:
- Chart and market context agree.
- Chart is clean, but market context is fragile.
- Market context is active, but the chart has not confirmed.
- Data is mixed, stale, or too noisy to support a strong claim.
That last category matters. A tool that sometimes says "unclear" is more useful than a tool that always invents certainty.
TradingView Is the Chart Layer
Traders who already trust their TradingView setup do not need another charting surface. They already have one.
TradingView is strong because it makes price structure readable. A trader can scan timeframes, compare indicators, mark support and resistance, run alerts, and keep the whole visual workflow in one place. That matters. Tools that force a trader to rebuild a familiar chart process usually create friction before they create insight.
TradingView also has broker-dependent market-depth surfaces such as DOM and Level 2 data. That matters because the honest comparison is not "TradingView has no orderbook tools." The sharper point is scope. DepthSignal is built as a separate market-context layer around order flow, cross-venue context, depth, spread, toxic-flow context, and data quality checks.
The limitation is not TradingView. The limitation is asking price-derived indicators to answer questions that live below the chart. RSI does not know whether buyers are lifting offers or sellers are hitting bids. MACD does not know whether the spread has widened. A Bollinger Band touch does not know whether displayed depth is still there.
That is why the useful pairing is not "TradingView versus DepthSignal." It is chart state beside market state, and the second layer changes how the first one should be read.
Indicators Describe Price History
Indicators are not broken because they lag. They are useful because they simplify price history.
The problem starts when traders treat price-derived indicators as independent evidence about current liquidity. RSI, MACD, EMA crosses, and Bollinger Bands all process past price. They can describe momentum, trend, extension, and volatility. They do not measure who is crossing the spread now.
Take an illustrative setup. RSI drops below 30 on a five-minute chart, price touches a prior support level, and the candle starts to recover. On the chart, that looks like a clean mean-reversion setup. Underneath, sellers may still be hitting the bid, bid depth may be thinning, and the spread may have widened. The chart says oversold. The auction says fragile.
That does not mean the indicator is wrong. It means the indicator made a smaller claim than the trader attached to it, which is the failure mode covered in why indicator-only trading fails.
Order Flow Adds the Missing Question
Price shows the result. Order flow shows observed buying and selling pressure around that result.
Order Flow Imbalance (OFI) measures whether buyers or sellers are more aggressive over a short window. It belongs beside TradingView indicators because it answers a different question. The indicator asks what price has done. OFI asks which side is crossing the spread.
This difference matters when the chart and the auction disagree. Imagine a resistance level holding for 20 minutes while buyers keep lifting the offer. Price is still flat. A price-only view sees rejection. Order flow may show pressure building into the level. The reverse is just as important: a bullish chart pattern with negative OFI is not the same setup as the identical pattern with buyer aggression behind it.
OFI is not a buy or sell signal. It is a pressure gauge. The practical value is in the disagreement, because disagreement forces the trader to reduce the claim instead of pretending one tool has answered everything.
Liquidity Changes the Meaning of the Same Chart
The same TradingView signal means different things in a deep book and a thin book.
A breakout through resistance with tight spread, replenishing depth, and balanced impact is one market state. The same breakout through widening spread, vanishing depth, and higher impact is another. The candle may look similar. The execution risk is not similar.
Depth is the first check. It tells you how much resting liquidity sits near price. Spread is the second check. It tells you how expensive immediacy has become. Price impact is the third check. It asks a practical question: how far does price move when aggressive flow arrives? Kyle's 1985 paper is the classic formal version of that problem.
This is where market microstructure becomes practical rather than academic. It does not replace the chart pattern. It changes the size of the claim the chart pattern deserves.
Toxic Flow Is a Risk Layer, Not a Direction Arrow
Some traders want every tool to point up or down. That is the wrong demand.
Toxic flow measures adverse selection risk: the risk that one side of the market is trading with better information or stronger urgency than the liquidity providers facing it. VPIN is one academic way to frame that problem. High toxic-flow context does not tell a trader direction by itself. It says the market is less clean than the chart alone suggests.
This matters when TradingView indicators appear aligned. Three price-derived tools can agree because they all read the same input. That is not confirmation. It is repetition. Different data earns more respect: order flow, depth, spread, impact, and venue context.
The practical reading is narrower and safer. "The chart setup exists, but flow quality is poor" is a cleaner statement than "the signal failed." It also fits the risk-context framing in risk-aware signal interpretation.
Do Not Force a Decision From Conflicting Tools
The worst workflow is turning disagreement into a vote.
If RSI says buy and order flow says wait, the answer is not to average them into confidence. The answer is to reduce the claim. RSI may be saying price is extended. Order flow may be saying sellers are still aggressive. Both can be true at the same time.
A better workflow uses TradingView to define the chart question, then uses DepthSignal to test the market context around that question:
- Is order flow aligned with the chart setup?
- Is depth stable enough for the intended execution?
- Has the spread widened during the setup?
- Is price impact elevated relative to the recent context?
- Is toxic-flow risk high enough to make the signal harder to interpret?
If the answers conflict, the cleanest conclusion is often "the setup is unclear." That is not indecision. It is refusing to make a stronger claim than the data supports.
Venue Context Prevents False Completeness
A single chart can look complete while the market is fragmented underneath it.
The displayed price on one venue is not the whole market. Order flow can concentrate on one exchange, spread can widen on another, and depth can disappear first where liquidity is weakest. A trader using one chart should be careful with market-wide language unless the data covers more than one venue.
This is why data quality and fragmentation matter. A strong local imbalance may be a real early signal, local noise, or pressure that other venues are already absorbing. Without broader context, the trader only knows what one feed showed. Exchange fragmentation and single-venue risk is the deeper version of that problem, and data quality for crypto signals is the operational version.
DepthSignal's role is to absorb much of the data-layer burden: orderbook collection, market-context features, and the engineering work needed to make those measurements usable. Building this layer properly is a continuous infrastructure problem, not a weekend indicator script.
When DepthSignal Deserves a Place Beside the Chart
A second screen has to earn its place. DepthSignal earns that place when the chart setup depends on market conditions the chart cannot show by itself.
A trader would check DepthSignal before relying on a clean chart setup when liquidity is thin, spread is widening, order flow conflicts with the indicator, price impact is high, venue behavior is fragmented, or the signal depends on fast execution. Those are not decoration metrics. They change whether the chart setup deserves confidence, caution, or no strong conclusion.
That is also the value question behind a paid workflow. A tool beside TradingView is worth attention only if it helps remove bad confidence. DepthSignal is not trying to add another indicator to the chart. It is trying to answer whether the market underneath the chart can support the claim the trader is about to make.
Where DepthSignal Fits
DepthSignal is a market microstructure analytics platform by Ravenna OÜ in Estonia. It is not a TradingView replacement. It is a context layer for traders and teams who already understand that price charts compress too much.
Use TradingView for chart structure, indicators, alerts, watchlists, support and resistance, and visual review. Use DepthSignal to read the auction around the chart: order flow, liquidity, spread, depth, toxic-flow context, impact, and market context checks. The product fit is strongest when the question is not "what indicator should I add?" but "what is the chart missing?"
For product context, start with the platform overview, data sources, or technical docs. If the workflow fits, join the waitlist rather than replacing your existing chart setup.
That distinction protects the workflow. TradingView keeps the visual surface. DepthSignal adds the market context that price-derived indicators cannot produce from the same candle inputs.
Conclusion
TradingView shows the chart. DepthSignal shows more of the market state around the chart.
That pairing is the point. Technical indicators still have a role, but they should not carry claims about order flow, liquidity, spread, depth, toxic flow, or execution risk. Those claims need different data.
When the chart says one thing and the orderbook says another, the disciplined response is not to force a trade narrative. It is to make the claim smaller. The chart is still useful. It was just never the whole auction.
See how DepthSignal fits beside your chart workflow.
References
- Cont, R., Kukanov, A., and Stoikov, S. (2014). The price impact of order book events. Journal of Financial Econometrics, 12(1), 47-88.
- Kyle, A. S. (1985). Continuous auctions and insider trading. Econometrica, 53(6), 1315-1335.
- Easley, D., Lopez de Prado, M. M., and O'Hara, M. (2012). Flow toxicity and liquidity in a high-frequency world. The Review of Financial Studies, 25(5), 1457-1493.
- Hasbrouck, J. (2007). Empirical Market Microstructure. Oxford University Press.
- TradingView. Pine Script repainting documentation.
- TradingView. Pine Script execution model documentation.
- TradingView. Depth of Market (DOM): what it is and how traders can use it.
- TradingView. Level 2 data.